
Bitmovin Player and Analytics: Better Together!
Unlock the power of Bitmovin Analytics data across every Bitmovin Player instance, with just one click!
Yes, it’s that simple. Watch this quick video to learn how to test both the Bitmovin Player and Analytics products with a free, 30 day trial.
We’ve always believed in data driven development, which is why we built our Analytics product in the first place. It was initially developed for our internal player teams to help debug common playback issues, quality snafus and trace problems across the entire video workflow chain so we can continuously iterate and optimize for that perfect playback experience.
Over the last year, we took the Analytics product from a closed Beta release to General Availability through early customer testing and incorporated numerous iterations through their feedback. We have also added a whole lot of features along the way such as Ads Dashboard, Fraud Detection and much more. We formally launched the product and saw great traction across a wide range of AVOD and SVOD customers globally.
Today, we’re excited to extend this to all player developers so you can test and optimize your current video player experience and see the power of data and actionable insights for yourself!
We’re excited to announce that we’re making a 30-day free trial available across all Bitmovin Player accounts starting immediately.
We’re automatically bundling this in so all you need to do is click a simple “Enable Analytics License” button on your Bitmovin dashboard and follow a few simple steps to allow analytics data collection across new player deployments*.
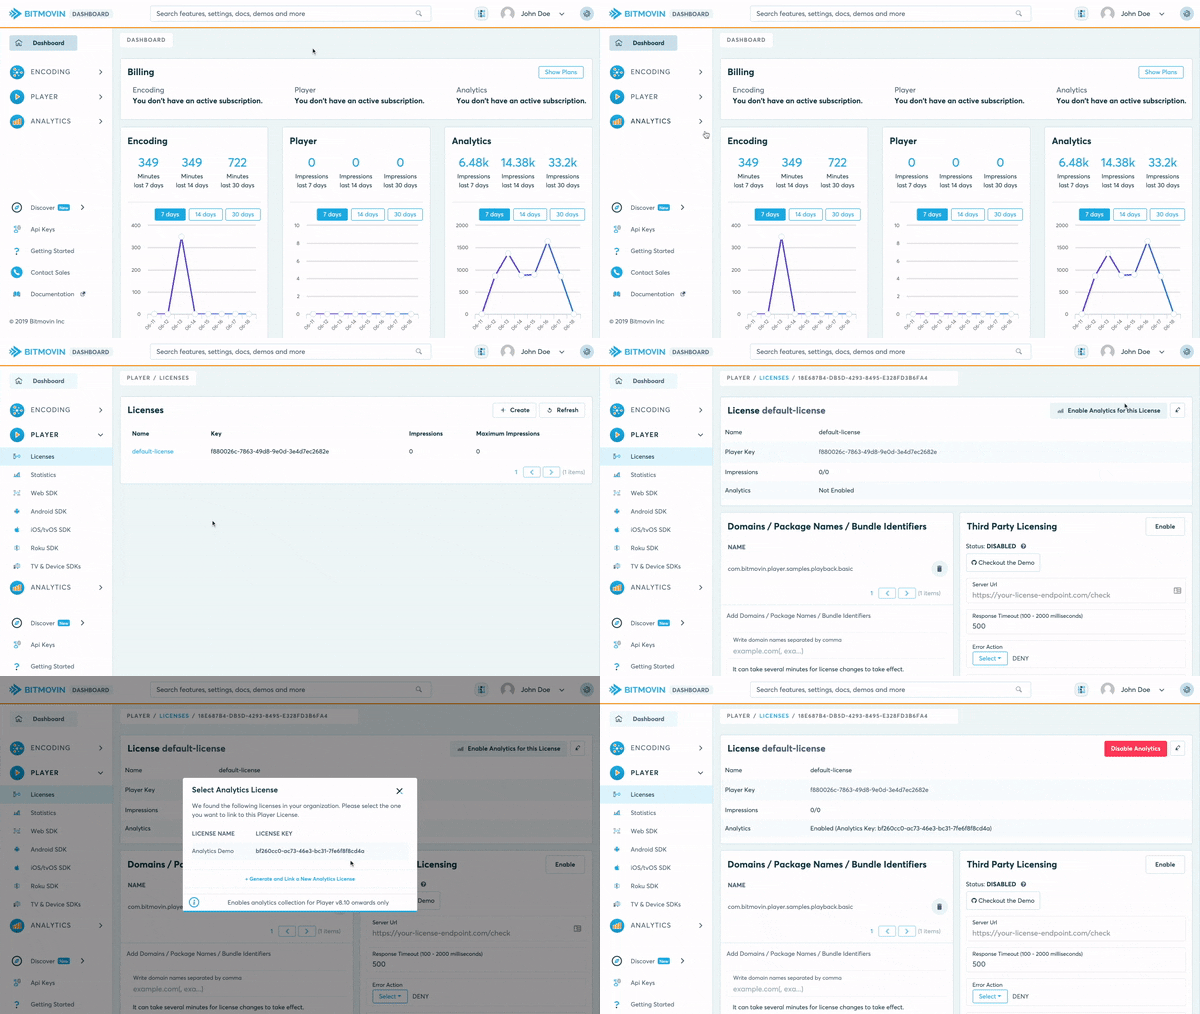
The 30-day free trial starts once you enable the license. You can locate more information on the enablement steps here.
Once a free trial is enabled, you can access key content and viewership metrics like
- Total content impressions or plays
- Total unique users and concurrent users
- Time watched
This can be sliced and diced by every browser and device so you can see the general distribution of viewers across your video service.
Have multiple sites and apps? No problem, we allow you to segment by specific domains, player versions and any custom filter that you would like to set up and monitor!
Want to know which titles are going to make the monthly top charts? Simply select “Video Title” in the Global Filters view to surface this data in the dashboard.
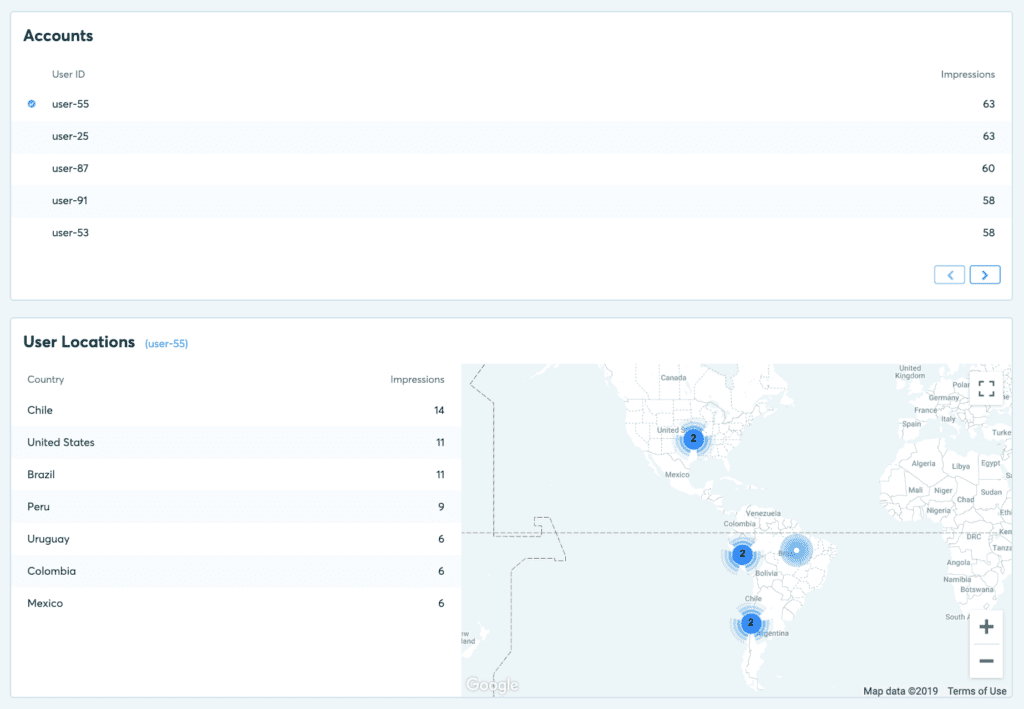
We’ve also enabled a special map view that visualizes simultaneous logins from the same user, watching the same content, at the same time, to help track down unauthorized account sharing instances. Content owners can monitor this view to crack down on shared logins to warn users or shut down access as they deem fit.
You might say “Wait! That does not help me fix any issues. I did everything right to set up the video player but my Customer Support team keeps getting calls from users about nagging video quality issues and they don’t even share enough details of what went wrong”
Not to worry, we’ve got you!
You can review your video player set up and monitor the viewer experience by individual viewing sessions in real time!
You can see all the details of the user who reported the issue and also see exactly what happened with that specific user session from the time they started playing the video to the time they paused, resumed again and hit a snag!
All you need is a unique identifier that allows you to recognize the subscriber or user in our system, if one is not made available, we can assign a unique ID too.
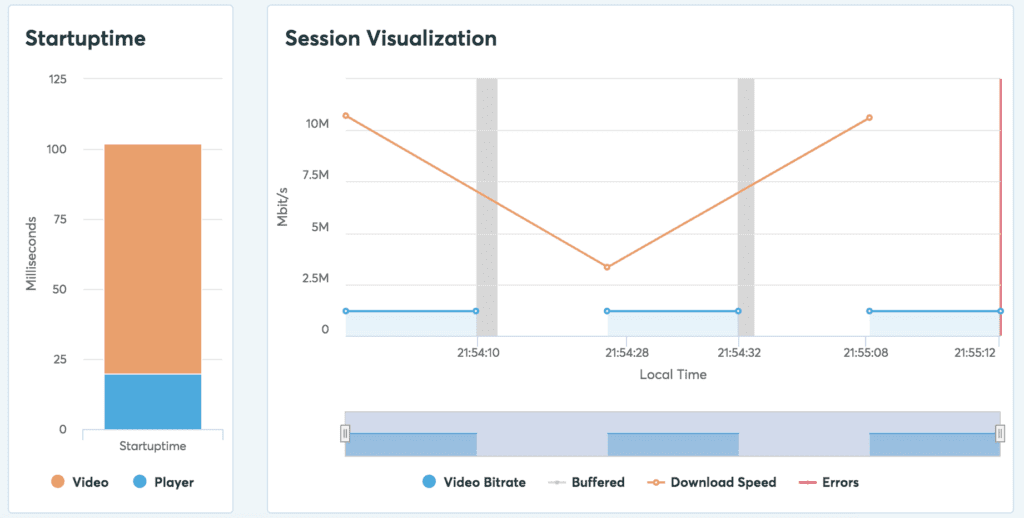
you can look at the affected user’s startup time, bandwidth connection, download speed and see exactly where they encountered an error without ever having to contact the user!
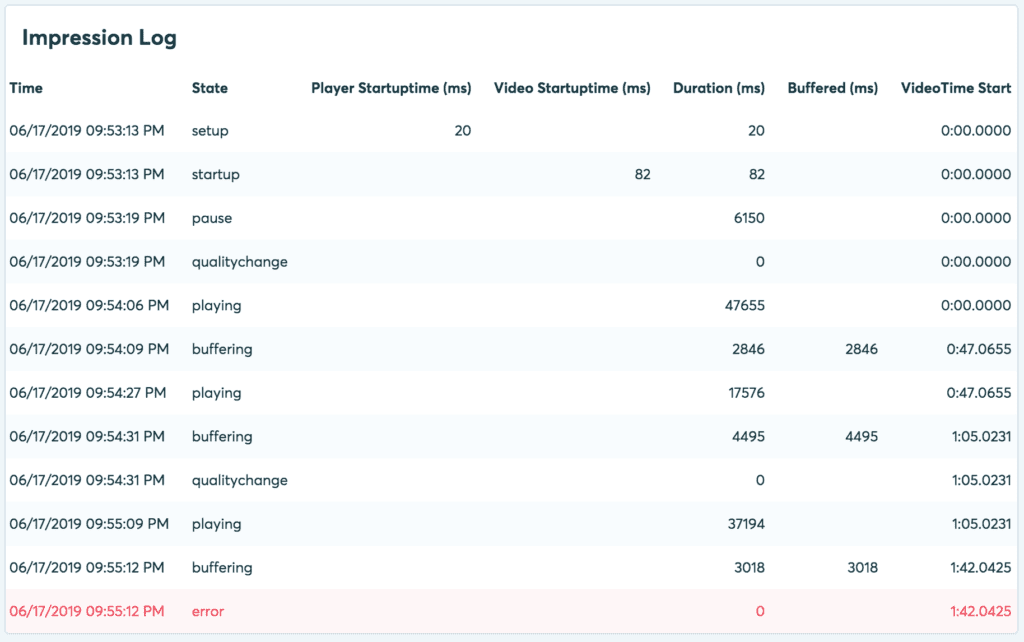
If video session visualization is not detailed enough, you can also analyze every single player event for the affected user session to identify exactly when they played, paused, saw buffering and what bitrate they were watching before they saw the error message.
All of this data is meant to cut down back and forth with the affected user. A lot of times, users are not savvy or don’t have the patience to justify their problems and just end up dis-engaging or leaving the service. There ARE so many streaming options today that they just don’t have the patience to deal with something not working instantly.
Our goal is to enable developers to troubleshoot and diagnose problems quickly and efficiently before users see them. Up next, we’re going to be releasing predictive alerting to help you do exactly that!
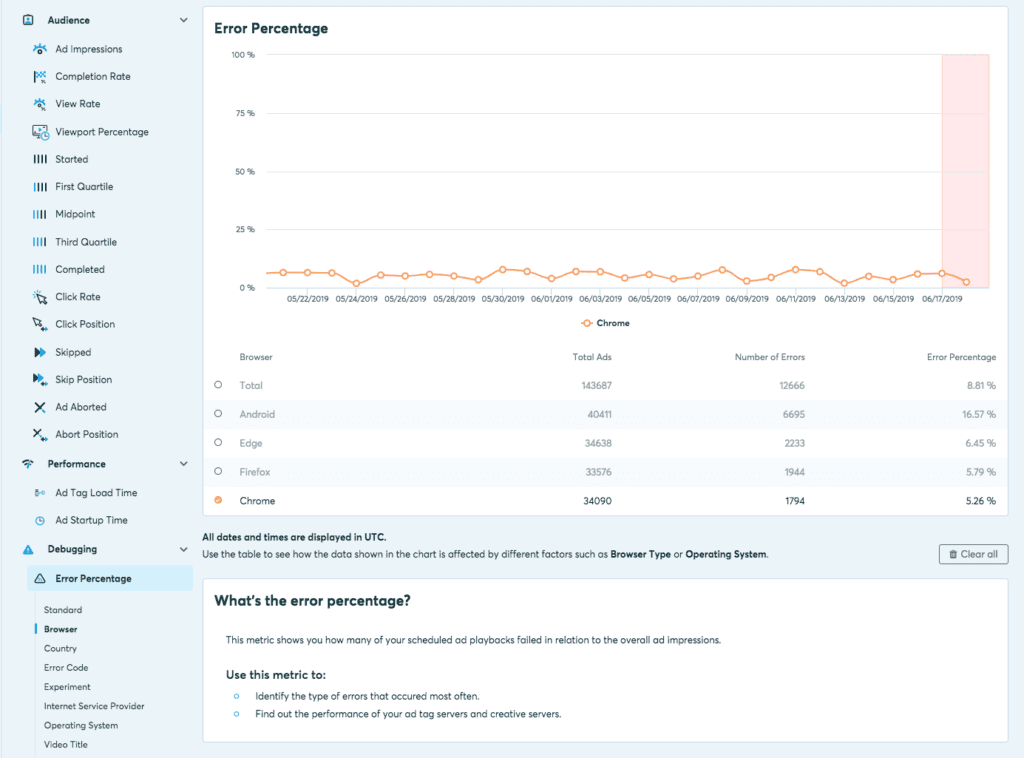
Check out more developer focussed metrics here.
In addition to basic video QoS metrics, Bitmovin also collects data on CDN performance, DRM license request and response turnaround time, Ads turnaround time so developers can troubleshoot issues across the entire video chain to see where things broke down or where things are sub-optimal so they can start looking into the right places to fix issues or raise issues.
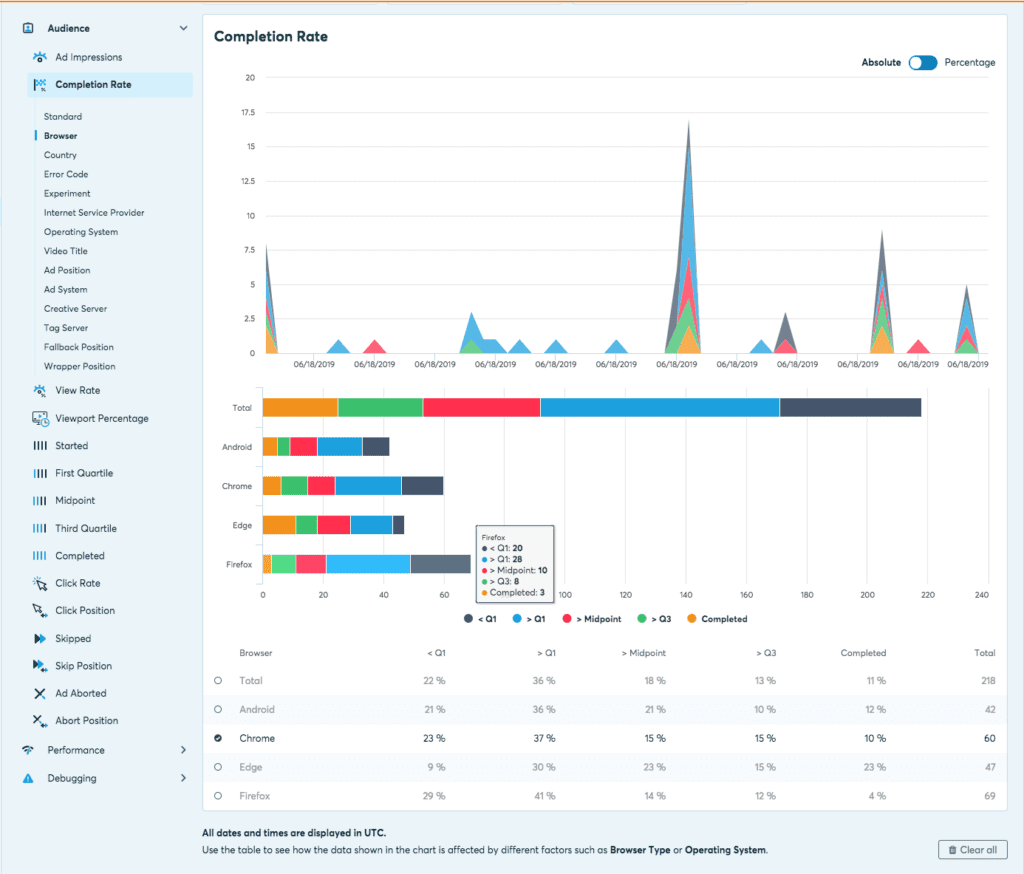
Read about our new and improved Ads Dashboard here.
Overall, we believe that the right data can empower teams to deliver great experiences for their viewers and we wanted to make this available to everyone to experiment for themselves. We’re eager to hear from you so please contact us if you have any questions or feedback along the way.
Learn more about the complete analytics offering by clicking here.
Start your free analytics trial or register for our Better Together: Player and Analytics webinar to learn more!


Video technology guides and articles
- Back to Basics: Guide to the HTML5 Video Tag
- What is a VoD Platform?A comprehensive guide to Video on Demand (VOD)
- Video Technology [2022]: Top 5 video technology trends
- HEVC vs VP9: Modern codecs comparison
- What is the AV1 Codec?
- Video Compression: Encoding Definition and Adaptive Bitrate
- What is adaptive bitrate streaming
- MP4 vs MKV: Battle of the Video Formats
- AVOD vs SVOD; the “fall” of SVOD and Rise of AVOD & TVOD (Video Tech Trends)
- MPEG-DASH (Dynamic Adaptive Streaming over HTTP)
- Container Formats: The 4 most common container formats and why they matter to you.
- Quality of Experience (QoE) in Video Technology [2022 Guide]

