This is the third and final part of our series on high quality video streaming where we discuss the results of our experiments, our findings and conclusions that can be drawn from the data, particularly in relation to adaptive streaming with MPEG-DASH.
Experimental Results
The average media throughput in terms of bitrate [kbps] is shown in Figure 3. The “Available Bandwidth” on the left side of the figure shows the average bandwidth according to the predefined bandwidth trajectory used in the evaluation. The “Measured Bandwidth” by the clients is shown next to it, which is typically a bit lower than the available bandwidth due to the network overhead. The results of the different adaptation logics is shown subsequently and Bitmovin’s Adaptive Streaming Player (formerly known as the bitdash player) – on the very right side of the figure – is among the top three implementations, namely 1. OSMF (1170.65 kbps), 2.Liu (1129.69 kbps), and 3. Bitmovin (bitdash) (1109.43 kbps). However, taking into account the average media throughput only is a fallacy when investigating the number of stalls as depicted in Figure 4. Interestingly, among the top three, only the Bitmovin player does not produce any stall, whereas the client with the best average media throughput produces the highest number of stalls – obviously not good for high QoE.
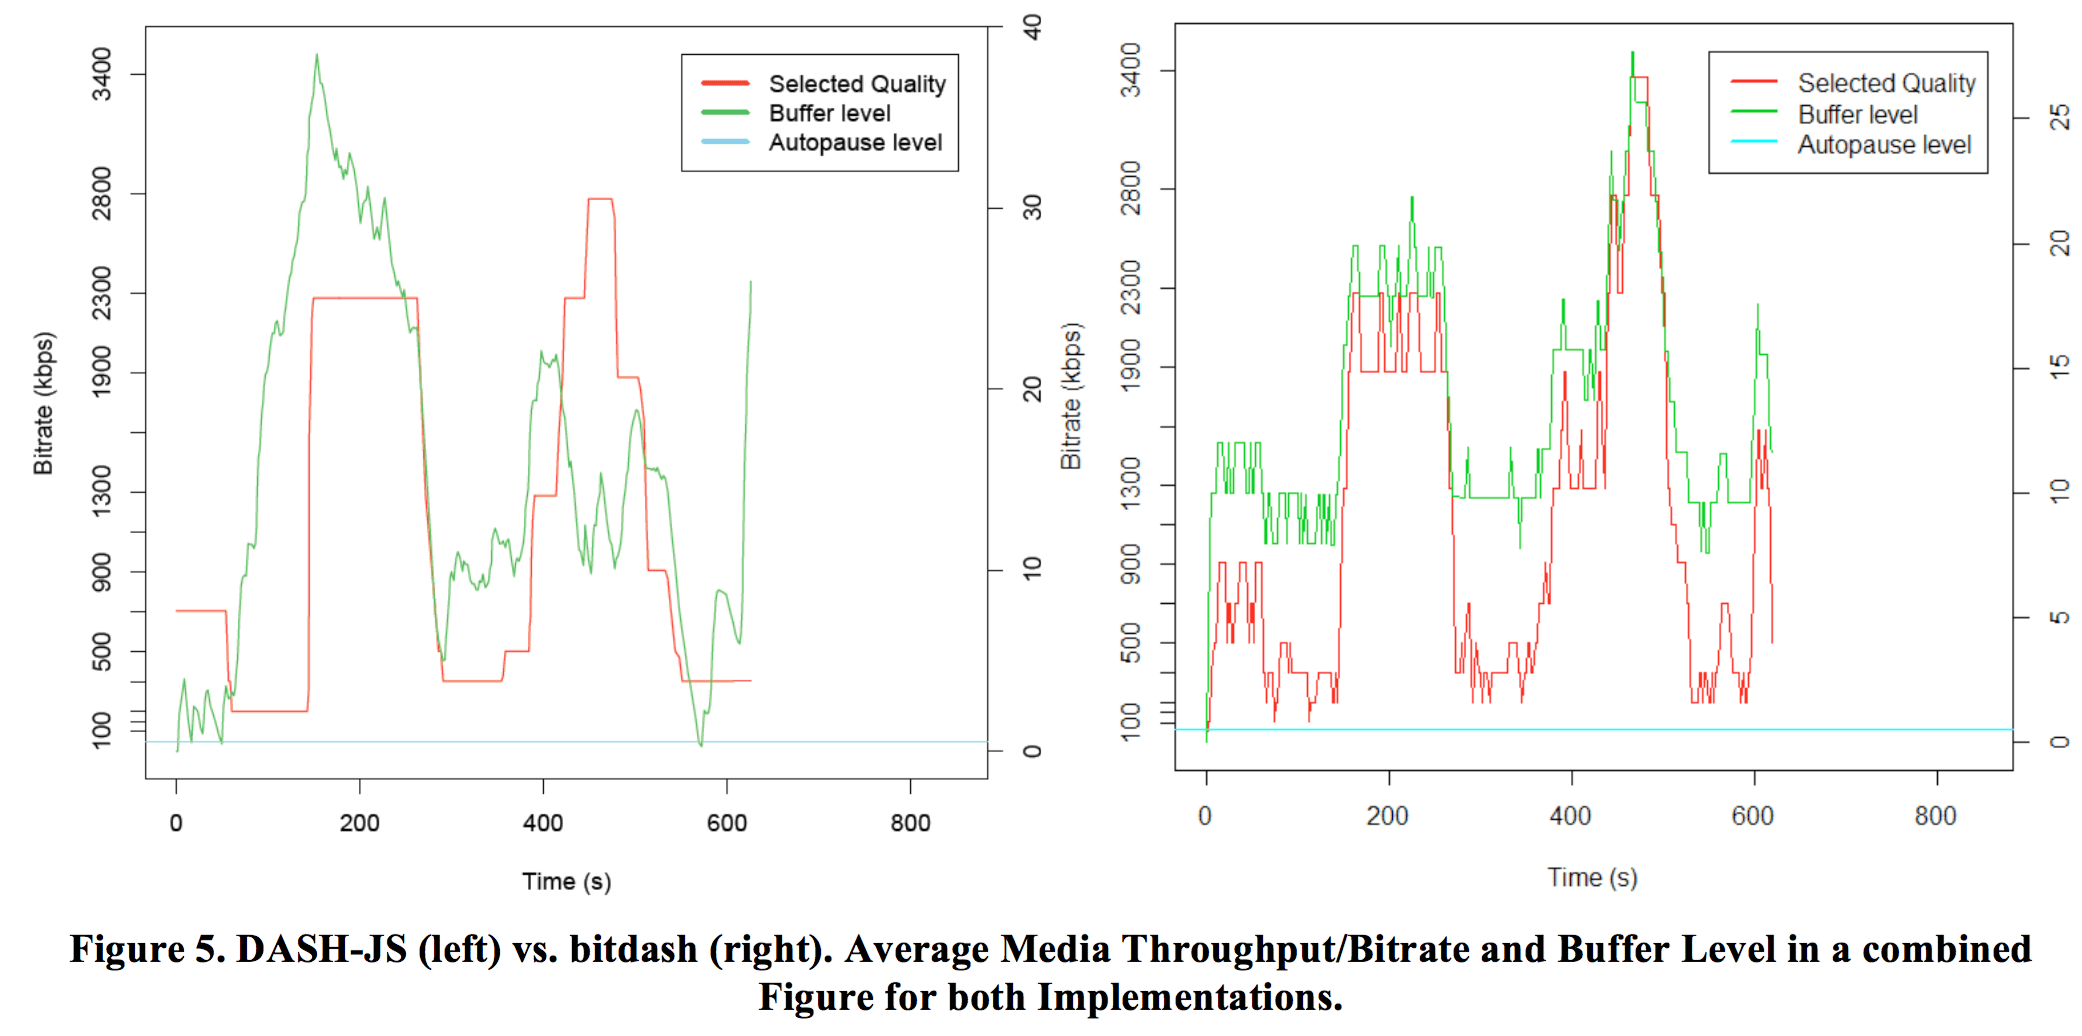
In addition to the overall results, we show a comparison of Bitmovin and DASH-JS – http://dash.itec.aau.at, one of the first DASH implementations – which is depicted in Figure 5. The figure shows both the average media throughput/bitrate and buffer level for the two implementations. The green line represents the buffer level showing the three underruns/stalls for DASH-JS where it falls below the autopause level (two at the beginning and one at the end) that causes the player to stop the playout and enter into a re-buffer phase. Bitmovin’s player does not cause any playback interruptions and is able to maintain a stable buffer level that corresponds to the available bandwidth. The red line shows the selected quality and both implementations are able to react very accurately according to the available bandwidth.

For the subjective evaluation, in total 220 microworkers participated in the subjective quality assessment from which 19 participants were excluded from the evaluation (due to issues during the crowdsourcing test as outlined in Section 3.3). From the remaining 201 participants, 143 were male and 58 female with an average age of 28. The results presented in this section reflect the behavior of the adaptation logics in a real-world environment with subjects spread across Europe accessing the test sequences over the open Internet.
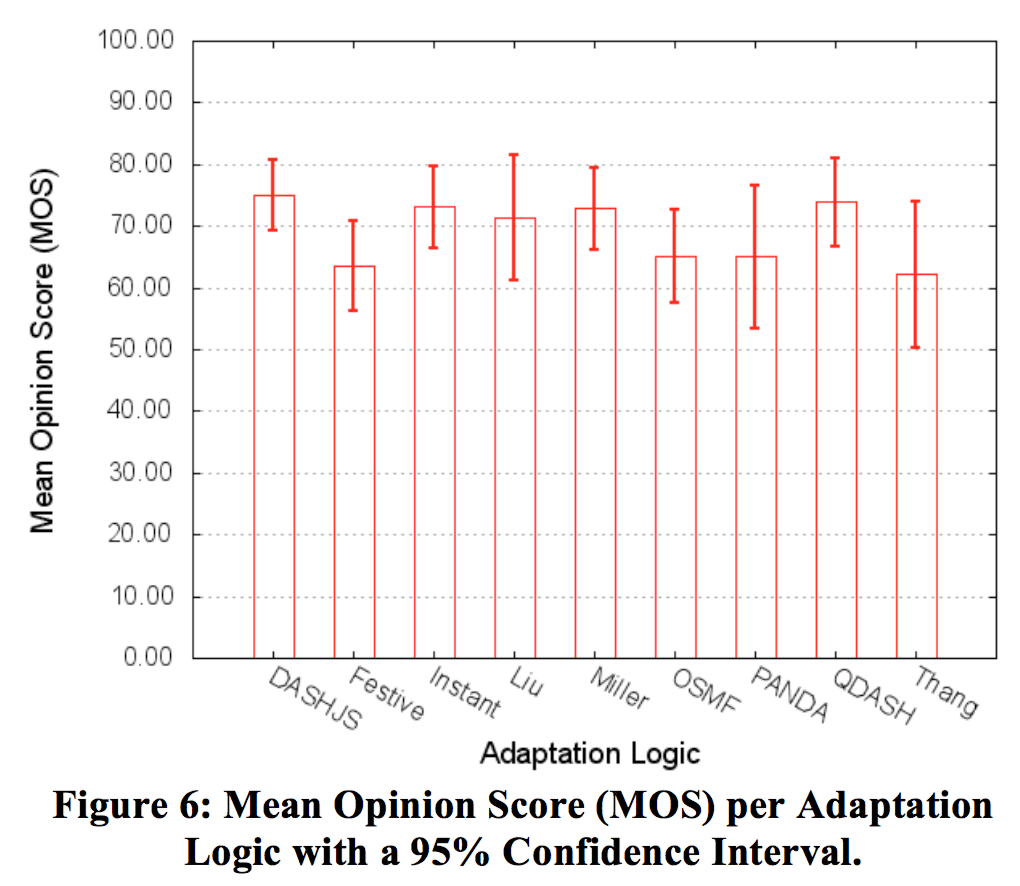
 Figure 6 depicts the QoE in terms Mean Opinion Score (MOS) per adaptation logic (95% confidence interval). Interestingly, DASH-JS (and also Instant) provides the highest MOS value but due to overlapping confidence intervals, relatively little can be stated as to whether it performs significantly better than the other algorithms. However, it provides a good indication regarding its effectiveness in a real-world environment. OSMF does not have the lowest MOS value despite its worse performance during the objective evaluation. In particular, Thang has the lowest MOS value although – during the objective evaluation – it does not cause any stalls but comes with a relatively low media throughput for both segment sizes.
Finally, we would like to share insights from a different study comparing DASH-JS, dash.js (DASH-IF reference player available at http://dashif.org/), and YouTube based on the work by Rainer et al.
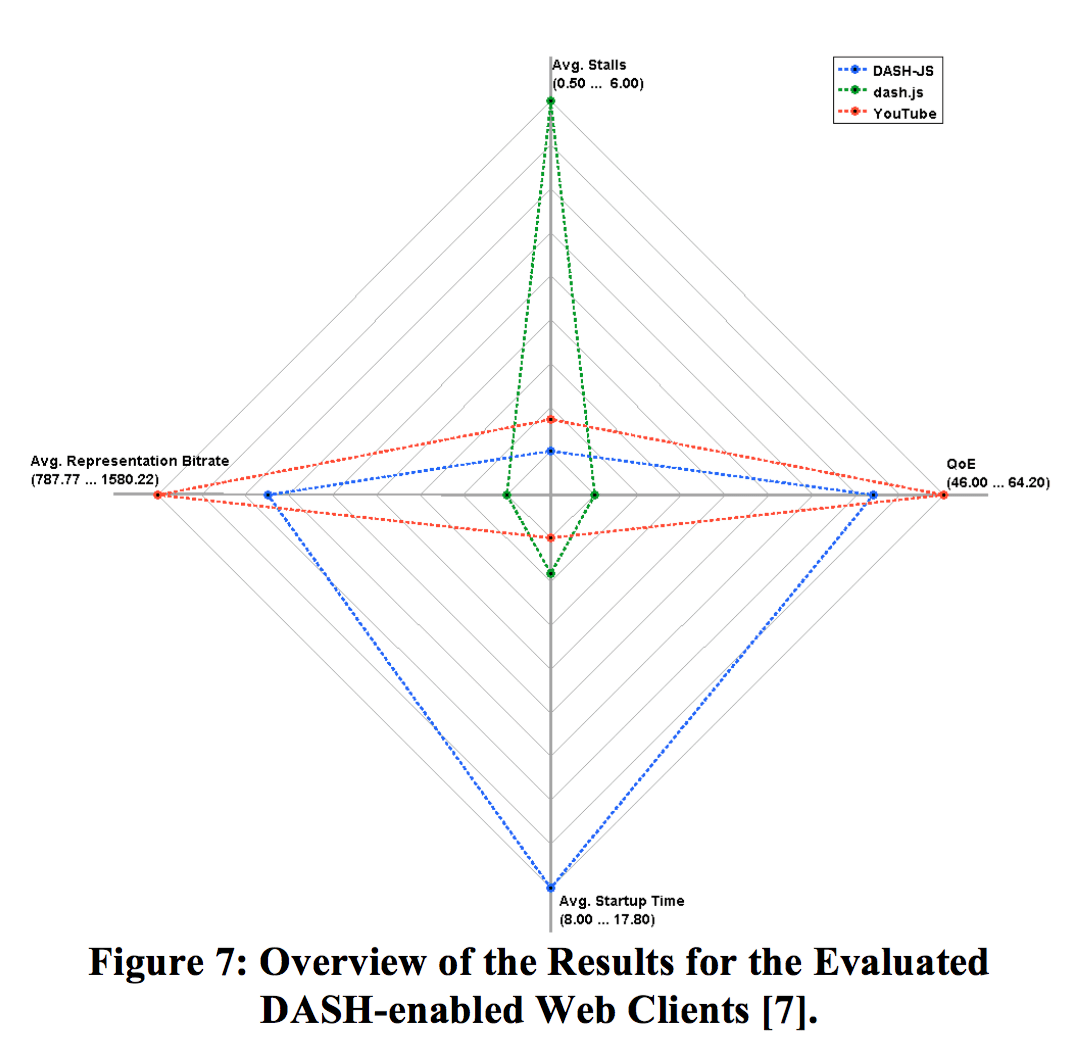
 Figure 7 shows an overview of the results along four dimensions: average representation bitrate (i.e., media throughput at the client), average startup time (or startup delay), average number of stalls, and the QoE in terms of Mean Opinion Score (MOS). DASH-JS maintains the lowest number of stalls (0.5 stalls on average) and the average representation bitrate is about 1,330 kbit/s. However, DASH-JS has the highest average startup time. The reason for this high startup time is that DASH-JS estimates the initial bandwidth when downloading the MPD and, thus, may select a higher bitrate in the be- ginning than the other clients. dash.js is outperformed by the other two DASH-enabled Web clients in three of the four dimensions. In particular, dash.js provides the lowest average representation bitrate, the highest number of stalls, and the lowest QoE. YouTube outperforms all other clients in three cases, specifically in the representation bitrate, startup time, and QoE. Furthermore, Figure 7 shows a correlation between the number of stalls and the QoE and that the representation bitrate also impacts the QoE, but is not solely responsible for the QoE.
Conclusions on Quality of Experience and MPEG-DASH
In this series of articles we have presented means for the Quality of Experience (QoE) evaluation of MPEG-DASH clients using objective/subjective measures and in controlled/real-world environments. An important finding is that the average media throughput/bitrate at the client cannot be used alone to describe the performance of MPEG-DASH clients and needs to be combined with other metrics such as the number of stalls. Interestingly, the start-up delay does not necessarily influence the QoE but buffer under-runs or stalls will definitely and also significantly impact the media experience and, thus, shall be totally avoided.
The findings presented in this article provide useful insights for current and future deployments of adaptive media streaming services based on the MPEG-DASH standard.


